Analysis & Interpretation
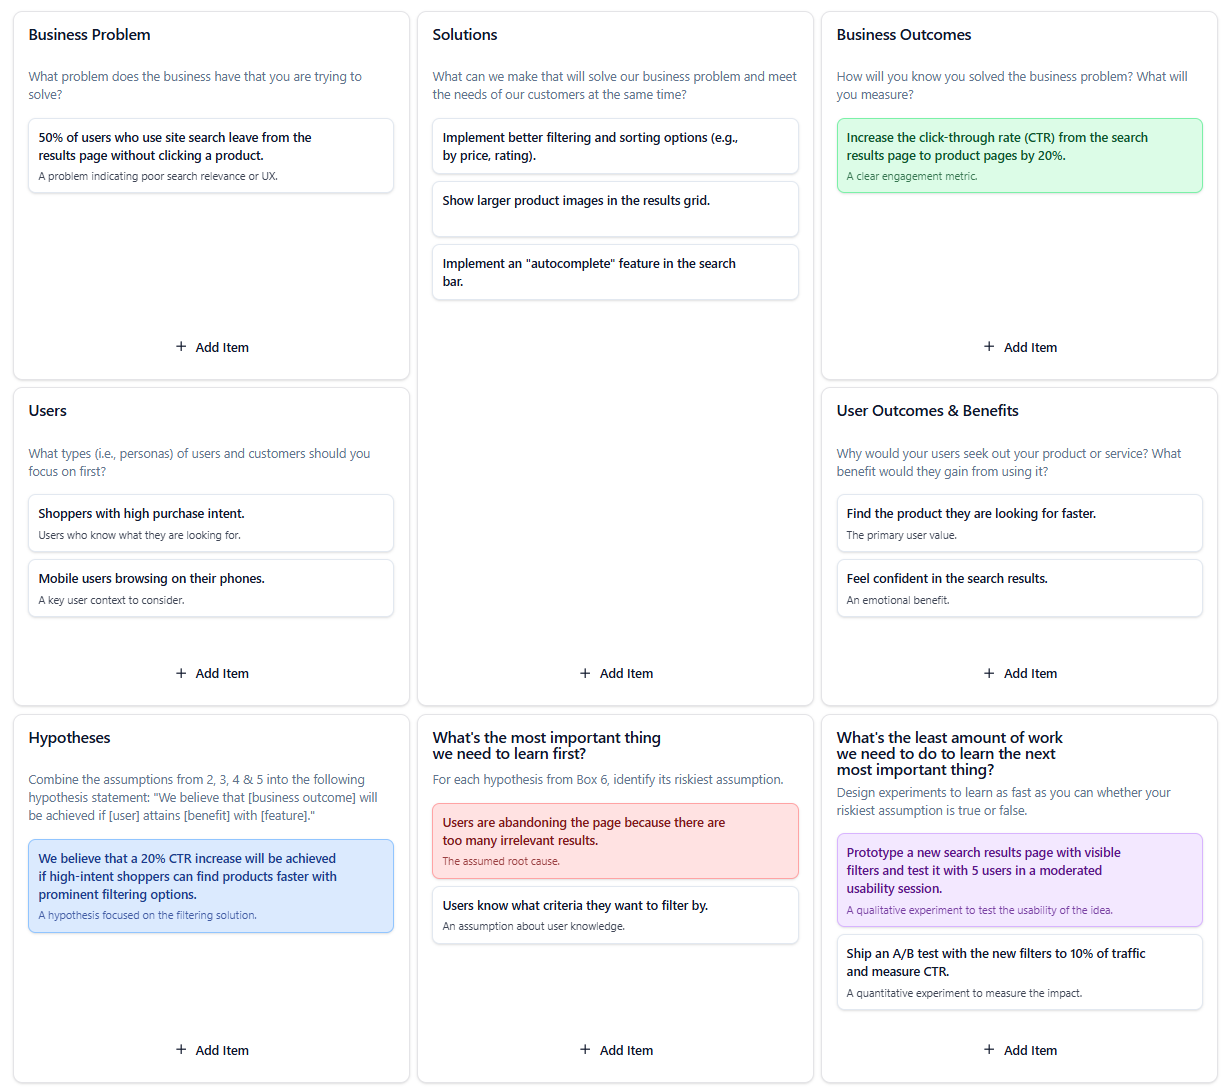
This canvas targets a leaky bucket in an e-commerce funnel: a high drop-off rate on the search results page. The team is trying to improve product discovery and move users from searching to finding.
- Metric Pinpoints the Problem: The ‘Business Problem’ (‘50% of users… leave from the results page’) is a powerful metric that clearly identifies the page as a point of friction. The corresponding ‘Business Outcome’ (increase CTR by 20%) provides a clear measure of success.
- Connecting User Need to a Feature: The ‘Hypothesis’ creates a direct link between the user’s need (‘find products faster’) and a specific feature (‘prominent filtering options’). This ensures the team is building something that directly serves a user goal.
- Qualitative and Quantitative Experiments: The canvas wisely proposes two types of experiments. A qualitative ‘usability session’ will answer *why* users are struggling and if the proposed solution is intuitive. A quantitative ‘A/B test’ will then measure the actual *impact* of the solution on the target metric (CTR).
This is a well-structured approach to solving a specific usability and conversion problem. The combination of qualitative and quantitative testing is a best practice. The team should start with the qualitative usability test to de-risk their design. If the prototype performs well, they can then proceed with the A/B test to validate its impact at scale.